Creating Org Charts For Very Large Organisations with the OrgChartComponent
Introduction
The OrgChartComponent can easily draw org charts straight from either an Xml file
or relational database like MS-SQL server quickly and efficiently.
Org Charts of several hundred nodes can be created without the programmer having
to think too much about performance and optimisation of the underlying data structures.
However what if the required organisation chart is sized at several hundred thousand
nodes?
Just as one would not expect to pass hundreds of thousands of rows of data to a
GridView or other ASP.NET control and expect it to perform passing a similar
sized data set to the OrgChartComponent is also challenging
The Org Chart Problem Compounded!
The basic problem of “too much data” is compounded by the fact that to
draw an org chart from a database the data set passed to the component must contain
all the data that the user wishes to see.
The nature of a hierarchy represented in a SQL database table means that there is
no simple method of sorting or ordering.
How for example, given the table structure described in Table 1. How would we write
a SELECT statement to return the data highlighted in Figure 1?
|
Id
|
ParentId
|
Name
|
|
1
|
Null
|
Root
|
|
2
|
1
|
Child 1
|
|
3
|
1
|
Child 2
|
|
4
|
2
|
Child 1-1
|
Table 1. A Simple Org Chart Represented in a Data Table
(For more information on representing organisation charts in SQL Databases refer
to http://www.orgchartcomponent.com/walkthrough/Article1/)
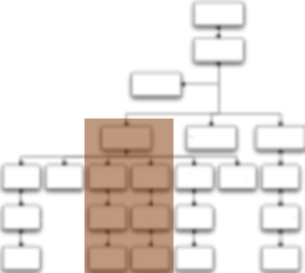
Figure 1. The Required Data Set For the Org Chart
A Solution – Use an "Expansion Table"
To allow us to SELECT the required data we need a method to be able to efficiently
identify the child, grand children and great-grand children nodes of the node that
we wish to start the org chart from.
To do this we can take advantage of two key facts:
- Disk space is cheap – a terabyte of hard disk space costs the same as a meal out.
- Relational databases are extremely good at dealing with large tables
We can create an Expansion Table that will allow us to simplify the process of SELECTing
the nodes that we wish to chart. As its name implies this is an expansion of the
hierarchy table.
For each Node in the hierarchy the table contains one entry listing for that nodes
direct and indirect descendants and stores the original Node Id, Childs Id and the
level for each entry.
|
Id
|
ChildId
|
|
1
|
1
|
|
1
|
2
|
|
1
|
3
|
|
1
|
4
|
|
2
|
2
|
|
2
|
4
|
|
3
|
3
|
|
4
|
4
|
Table 2. Expansion Table of Table 1
Now we can simply JOIN the two tables together in a simple select to return a limited
data set with which to draw the org chart.
SELECT Hierarchy.Id, Hierarchy.ParentId, Name
FROM Hierarchy JOIN Expansion ON Hierarchy.Id = Expansion.ChildId
WHERE
	Expansion.Id = @ID_We_Wish_To_Chart
Once we have that data set we can pass it to the Org Chart Component (or other ASP.NET
control) and render the chart.
Sizing the Expansion Table
Nothing in the world is free and so the expansion table method exchanges disk space
for performance.
The best case scenario
The best case for an expansion table is where an organisation is structured so that
it has a single “Root” Node (The CEO) and with every other node reporting directly
into the root.
In this case the size of the table will be N*2 where N is the number of nodes in
the organisation.
In a 100k employee “flat structured” company this would be 100,000 * 2 = 200,000
If you work for a company with 100,000 employees and no structure then you probably
work for Google (allegedly).
The worst Case scenario
The worst case scenario for the expansion table method is a company (or other hierarchical
structure) where every employee (or node) has one and only one direct report with
the exception being the one employee at the bottom of the tree.
In this case the expansion table size will be:
1 + 2 + 3 + 4 ….. + n
Or the sum of all the numbers between 1 and n!
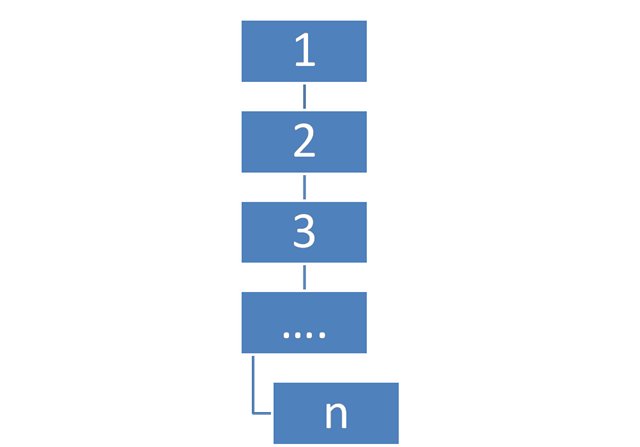
Figure 2. The worst hierarchy for an expansion table
In a 100,000 employee company where every employee has one and only one direct employee
the size of the expansion table will be:
1 + 2 + 3 + 4 ….. + 100,000 = 5,000, 050,000 or five billion and fifty thousand
rows!
Incidentally if you ever find yourself working for a company of such a structure
and your payroll number is in the mid 90k’s then it’s probably best to leave.
If the company is restructured so that there is two people at the top, each with
49,999 direct reports the size of the expansion table will be 2,500,050,000
Once the company decides to have 10 “chains” of 10,000 employees the size of the
table drops to 500,050,000. This is still a big number!
The most realistic Situation
Most large scale organisations have a significantly more complicated tree structure
than described and each branch of the tree helps shrink the overall size of the
expansion table. In reality the vast majority of a workforce do not have hundreds
of direct and indirect reports. In fact they are far more likely to have one or
none!
With a typical 100k sized organisation the expansion table is sized around 1 – 2
million rows.
The table size drops away rapidly and with a small alteration and the application
of common sense we can further reduce the size of the expansion table.
Limiting the Expansion Table to the Number of Levels to be Viewed
If the sole purpose of the expansion table is to allow the end users to view the
organisation chart then by adding a “level” column where the level is the depth
of the child from the parent node can further reduce the size of the required table.
The reality is that most org charts become difficult to view once showing more than
5 levels of the organisation at one time.
Therefore it makes sense to pick an arbitrary level number (for example 5) and to
stop calculating the expansion table entries for each node once they exceed that
number.
This then further slashes the size of the expansion table – but at the expense that
you cannot now show a chart of more than “n” levels deep at any one time.
|
Id
|
ChildId
|
Level |
|
1
|
1
|
0 |
|
1
|
2
|
1 |
|
1
|
3
|
1 |
|
1
|
4
|
2 |
|
2
|
2
|
0 |
|
2
|
4
|
1 |
|
3
|
3
|
0 |
|
4
|
4
|
0 |
Table 3. Expansion Table for Table 1 with Level
We can now refine our SQL SELECT by further limiting the query with an additional
WHERE clause.
SELECT Hierarchy.Id, Hierarchy.ParentId, Name
FROM Hierarchy JOIN Expansion ON Hierarchy.Id = Expansion.ChildId
WHERE
	Expansion.Id = @ID_We_Wish_To_Chart
	AND Expansion.Level <  @Number_Of_Levels_We_Wish_To_See
Creating the Expansion Table
Now that we have discussed the use of the expansion table I’ll round up the article
by describing how to create one.
Populating the hierarchy expansion table is a relatively trivial process. The following pseudo code function
should give you a good outline of the steps involved.
    PopulateExpansionTable ( Node, Level )
    Begin
	    For Each Child Of Node
		   Insert Row Into Table ( NodeId, ChildId, Level )
		   IF Child.HasChildren THEN
		    	PopulateExpansionTable ( Child, Level + 1 )
		   End
	    Next
    End
And that’s that. Although you do need to think about the following
- When and how often to calculate the expansion table
- How to handle inserts, updates and deletes from the hierarchy table
Hope this helps!