Creating a databound Organisation Chart Using the Organisation Chart Component
This walk through takes you through the steps necessary to create an organisation
chart bound to a data table held within a SQL database. The chart will have a header,
footer and display the firstname, last name and job title of each person in the
organisation.
This should take about 10 minutes to complete. The walk through was created
using SQL Server Express 2008 and Visual Studio.NET 2008
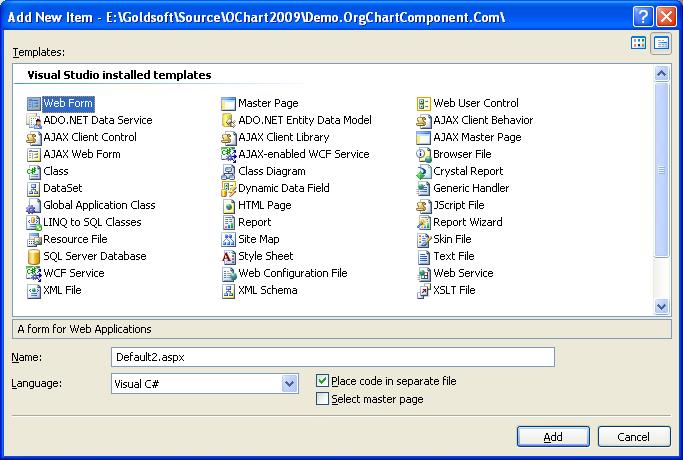
Step 1. Create a blank page!
We'll assume that you know how to create a blank page! But just in case
you don't here's a picture.
Step 2. Add a SQL Database and table
Next Create a table to hold the organisation chart data. In this example we
will create a chart that displays a firstname, lastname and jobtitle.
Again we are assuming that you are able to create a database.
In order to be able to draw a chart each row in the table will represent one person
in the organisation. Each row must have a UniqueId and a ParentId
which are the primary key and foreign keys for the data respectively. For
a full more detailed explanation of the table structures required click here
|
Create A Suitable Table Structure
|
USE [orgchartdemo]
GO
/****** Object: Table [orguser].[DataboundWalkThruData] Script Date: 01/26/2009 16:02:30 ******/
SET ANSI_NULLS ON
GO
SET QUOTED_IDENTIFIER ON
GO
CREATE TABLE [orguser].[DataboundWalkThruData](
[UniqueId] [int] NOT NULL,
[ManagerId] [int] NOT NULL,
[Firstname] [nvarchar](50) COLLATE SQL_Latin1_General_CP1_CI_AS NOT NULL,
[lastname] [nvarchar](50) COLLATE SQL_Latin1_General_CP1_CI_AS NOT NULL,
[jobtitle] [nvarchar](50) COLLATE SQL_Latin1_General_CP1_CI_AS NOT NULL,
CONSTRAINT [PK_DataboundWalkThruData] PRIMARY KEY CLUSTERED
(
[UniqueId] ASC
)WITH (PAD_INDEX = OFF, IGNORE_DUP_KEY = OFF) ON [PRIMARY]
) ON [PRIMARY]
|
|
And Then Insert Some Data
|
INSERT INTO DataBoundWalkThruData VALUES ( 1,0,'Tom','Smith','Director')
INSERT INTO DataBoundWalkThruData VALUES ( 2,1,'Bill','Jones','Sales')
INSERT INTO DataBoundWalkThruData VALUES ( 3,1,'Hillary','McCain','Finance')
INSERT INTO DataBoundWalkThruData VALUES ( 4,3,'Jude','Lore','Cleaner')
|
The
DataBoundOrganisationChart can chart tables
or views and can connect to any relational database supported by .NET
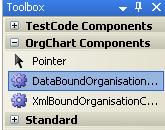
Step 3. Drop on a DataBoundOrganisationChart Component
The next step is to drop a DataBoundOrganisationChart
on to our page. Do this by selecting the DataBoundOrganisationChart
from your tool box as show below and dragging and dropping it onto your page as you would add any other server control.
|
This will create the following markup on in the code behind.
<cc1:DataBoundOrganisationChart ID="DataBoundOrganisationChart1" runat="server">
</cc1:DataBoundOrganisationChart>
|
If you cannot see the component in your toolbox then you must register it. The easy
way to do this is to drag and drop the OrgChart.Dll assembly that
you have either purchased or downloaded in the case you are using the demo component
onto the toolbox. This will automatically register the control.
Step 4. Bind The Chart To The Table
Now we must point the component at the data table created and populated earlier.
To do this click on the DataBoundOrganisationChart
controls smart tag and

|
|
step through the wizard, connecting to the database and selecting the data from
the table we created earlier.
|

|
|
Once completed the markup in the code behind will look like this:
<cc1:DataBoundOrganisationChart ID="DataBoundOrganisationChart1" runat="server"
DataSourceID="SqlDataSource1" LineColour="Blue" UserControlTemplate="">
</cc1:DataBoundOrganisationChart>
<asp:SqlDataSource ID="SqlDataSource1" runat="server"
        ConnectionString="<%$
                                    ConnectionStrings:orgchartdemoConnectionString1 %>"
        SelectCommand="SELECT [UniqueId],
                                    [ManagerId], [Firstname], [lastname], [jobtitle] FROM [DataboundWalkThruData]">
</asp:SqlDataSource>
|
Step 5. Create a header, footer and detail template
Now we can start the fun bit. Again from the designer, select
"Edit Templates". Then first choose "Header", then "Footer" and finally "Detail"
You can add any server or HTML into the template such as the DataGrid.
As you would assume the "Header" is drawn at the top of the
organisation chart, the "footer" at the bottom and the "Detail" Template is
drawn once for each row that is charted. Below is markup from my
chart.
<cc1:DataBoundOrganisationChart ID="DataBoundOrganisationChart1" runat="server"
DataSourceID="SqlDataSource1" LineColour="Blue" UserControlTemplate="">
<DetailedTemplate>
<asp:Label ID="Label1" runat="server" Text='<%# Container.DataElement("Firstname") %>'></asp:Label>
<asp:Label ID="Label2" runat="server" Text='<%# Container.DataElement("Lastname") %>'></asp:Label>
<asp:Label ID="Label3" runat="server" Text='<%# Container.DataElement("JobTitle") %>'></asp:Label>
</DetailedTemplate>
<HeaderTemplate>
This is where the header goes : Its got a button!<asp:Button ID="Button1"
runat="server" Text="Button" />
</HeaderTemplate>
<FooterTemplate>
This is the footer : Its got a button as well
<asp:Button ID="Button2" runat="server" Text="Button" />
</FooterTemplate>
</cc1:DataBoundOrganisationChart>
Step 6. Hit Run
Running the page will give us a chart like this :
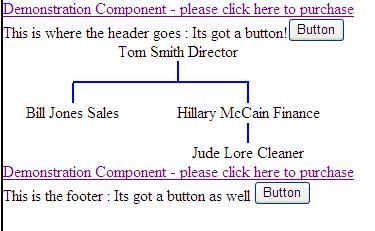
Whilst this is "Ok" its a bit, errr, boring. So finally we can spice it up
by using ...
Step 7. Add some colour to the chart using the ItemStyle, HeaderStyle and FooterStyle
In the Visual Studio designer, select the organisation chart component and then
view its properties.
Setting the ItemStyle, HeaderStyle and FooterStyle will change the appearance of
the organisation chart.
Our final efforts can be viewed here